Visual materials used in Pedersen DKG란?. These diagrams show how each participant creates a local polynomial, broadcasts coefficient commitments, exchanges and verifies shares, then aggregates final shares and a group public key.
- Source Markdown
- Participant 1 polynomial SVG
- Participant 2 polynomial SVG
- Participant 3 polynomial SVG
- Local contribution SVG
- Group polynomial SVG
- Round 1 commitment SVG
- Round 2 share exchange PNG
- Round 2 share verification SVG
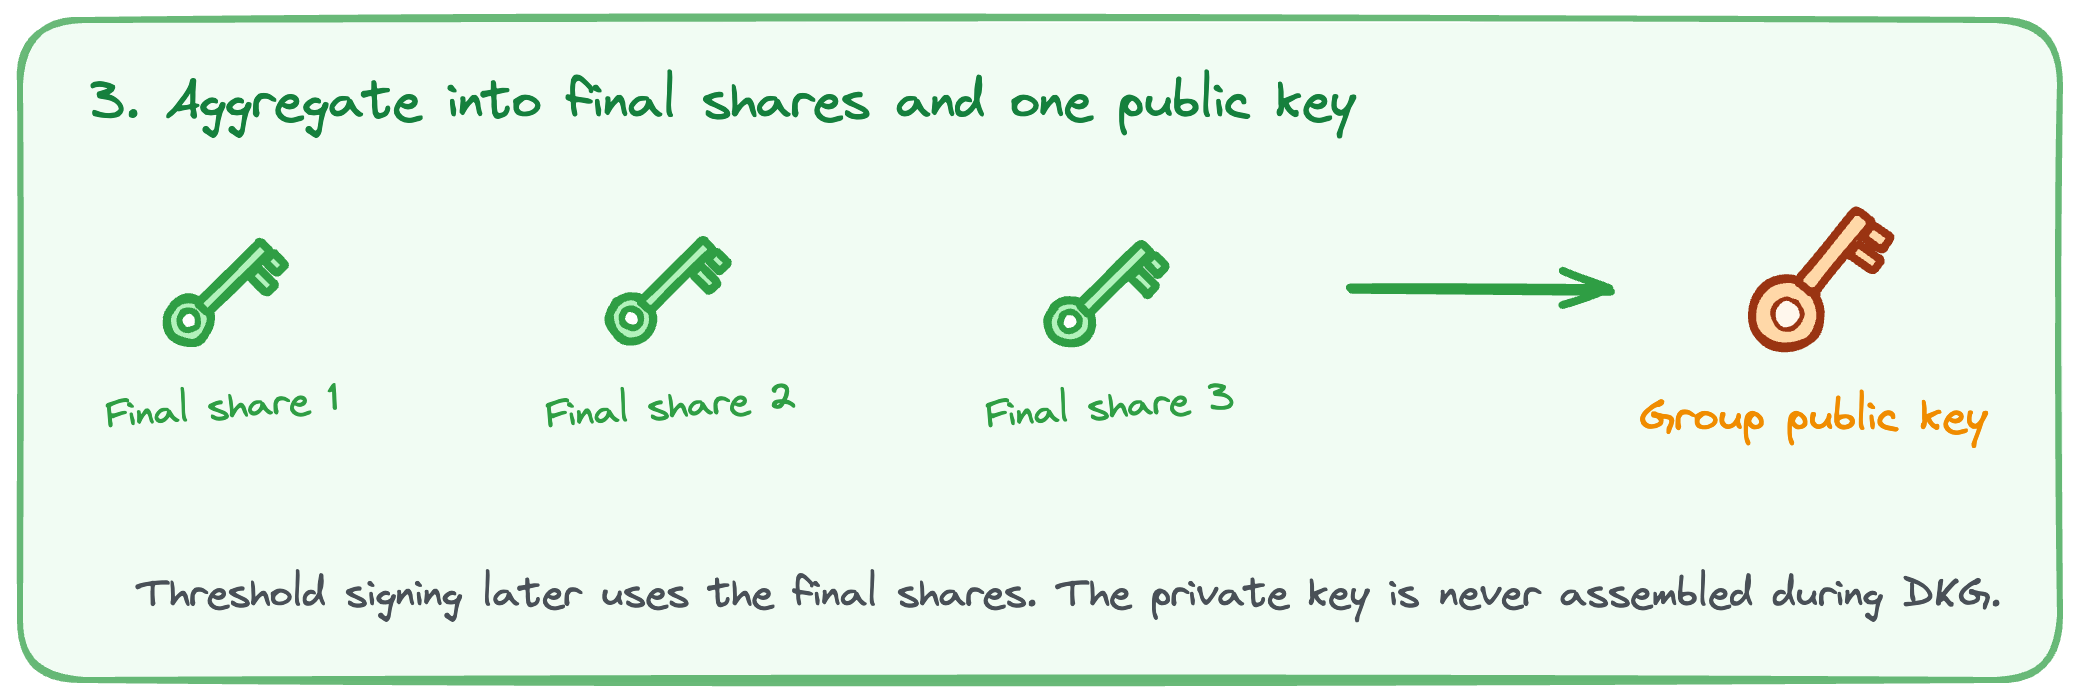
- Final shares PNG
Polynomial Form
When the threshold is t, each participant i samples a degree t - 1 polynomial:
The constant term is that participant’s local secret contribution:
For three participants:
Local Polynomial Shares
Participant 1

Participant 2

Participant 3

Local Contributions

Group Polynomial

Round 1 Commitments

Round 2 Share Exchange
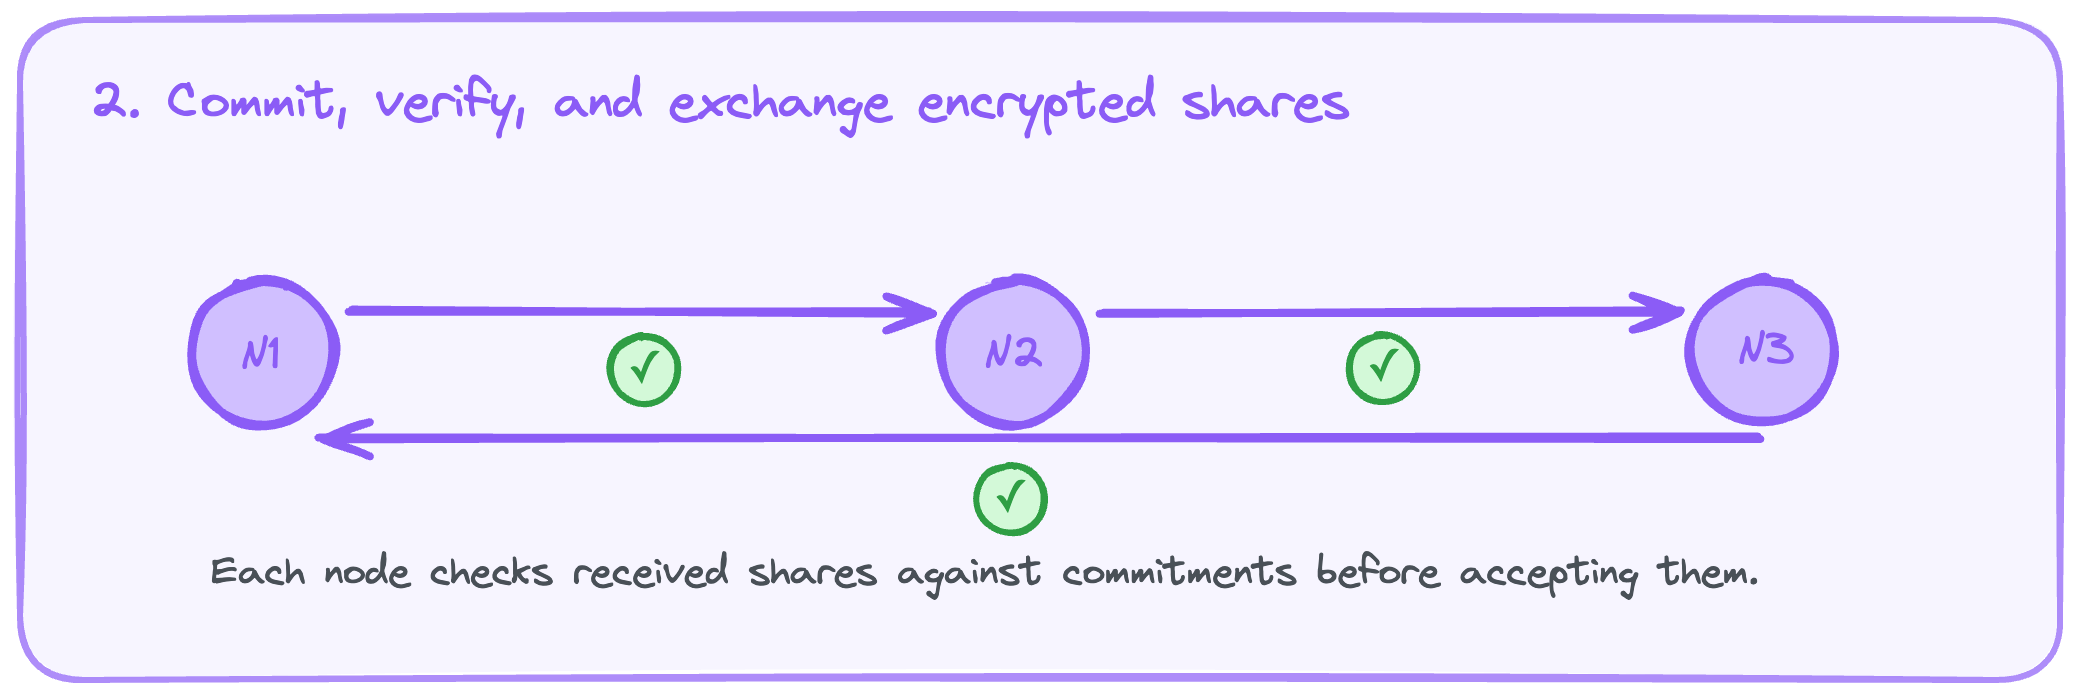
Round 2 Share Verification

Final Shares